
Retail-sales-case-study

This case study uses a simulated dataset I created for practice (4,800 orders, about $599K revenue). The method is real, and I'll apply the same steps to real business data.
The Question
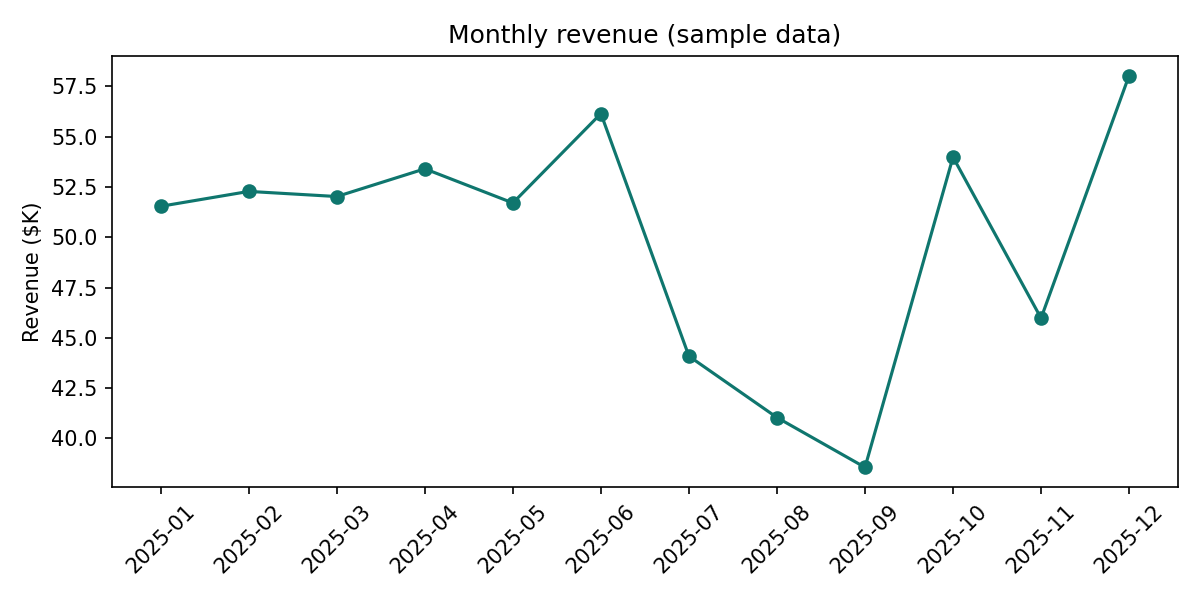
Revenue grew steadily in the first half of the year, then dropped in Q3. The business question: what caused the dip, and where should the team focus next?
The Data
One year of order-level data with these columns: date, category, region, customer (new or returning) and revenue.
How I Cleaned the Data
• Removed duplicates: repeated order IDs
• Checked missing values: filled or dropped depending on the column
• Fixed formats: standardised dates and category names
• Flagged outliers: used the IQR method on order values
import pandas as pd
df = pd.read_csv("retail_sales_sample.csv", parse_dates=["date"])
df = df.drop_duplicates()
df["category"] = df["category"].str.strip().str.title()
df["month"] = df["date"].dt.to_period("M")
monthly = df.groupby("month")["revenue"].sum()
Finding 1: Revenue Fell in July to September
Monthly revenue held at roughly $52-56K from January to June. It then dropped to about $44K in July, $41K in August and $39K in September, before recovering in Q4.
Finding 2: Electronics Drove Most of the Drop
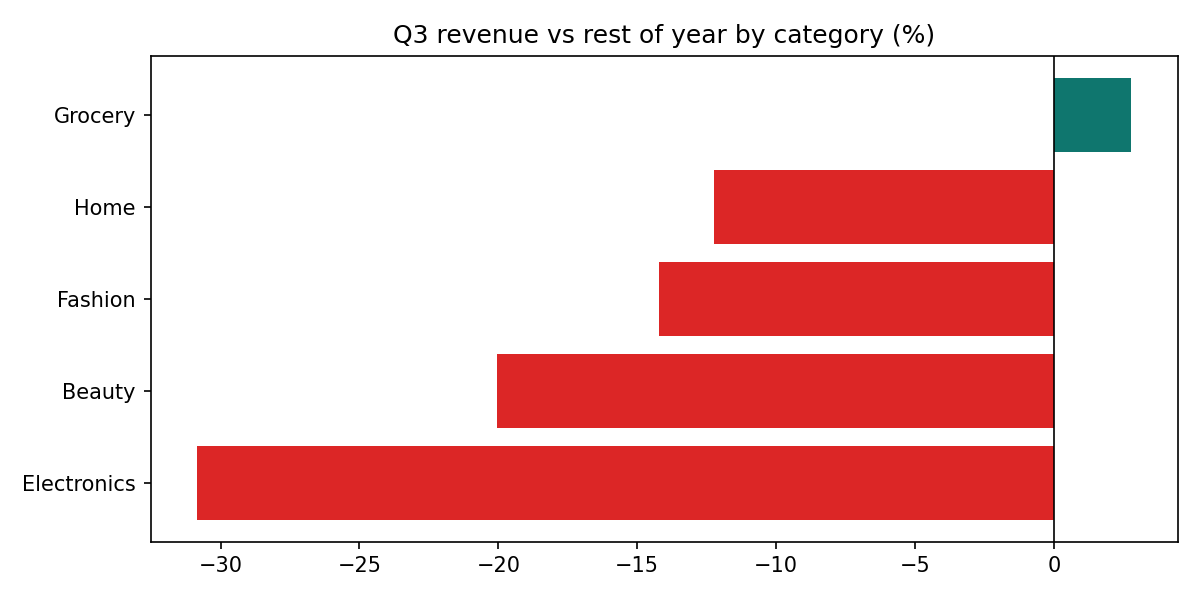
Comparing Q3's monthly average to the rest of the year, Electronics fell about 31%, the biggest drop. Beauty fell 20%, Fashion 14% and Home 12%. Grocery stayed flat (+3%), so everyday demand held up.
Finding 3: The South Region Was Hit Hardest
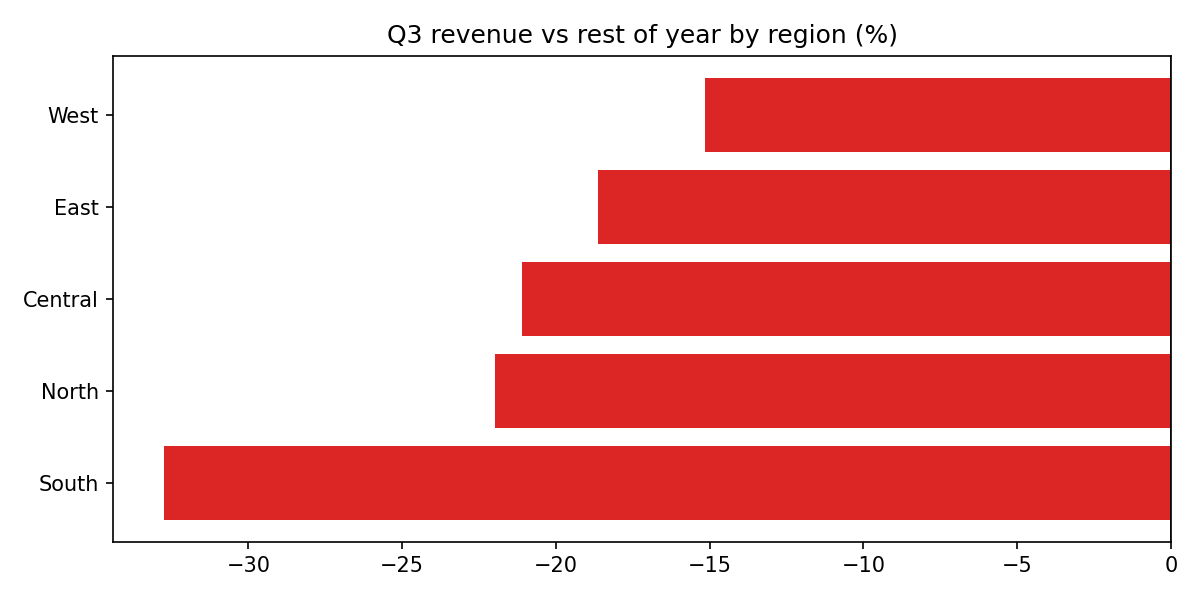
Every region declined in Q3, but the South fell about 33%, compared with 15-22% elsewhere. That points to a regional problem on top of the category issue.
One More Insight
Returning customers spent about $140 per order versus $113 for new customers, roughly 24% more. Keeping repeat buyers matters.
Recommendations
Investigate Electronics in Q3: check pricing, stock and competitor promotions.
Review the South region: look at delivery times, local campaigns and stock levels.
Invest in retention: loyalty rewards and win-back emails for returning customers.
Track weekly KPIs: build a Power BI or Tableau dashboard so dips are caught early.
Tools used: Python (pandas, matplotlib), Excel, SQL
About the author
- Love what I do and do it best
Comments
Join the discussionNo comments yet. Be the first to comment.